

Where to see it
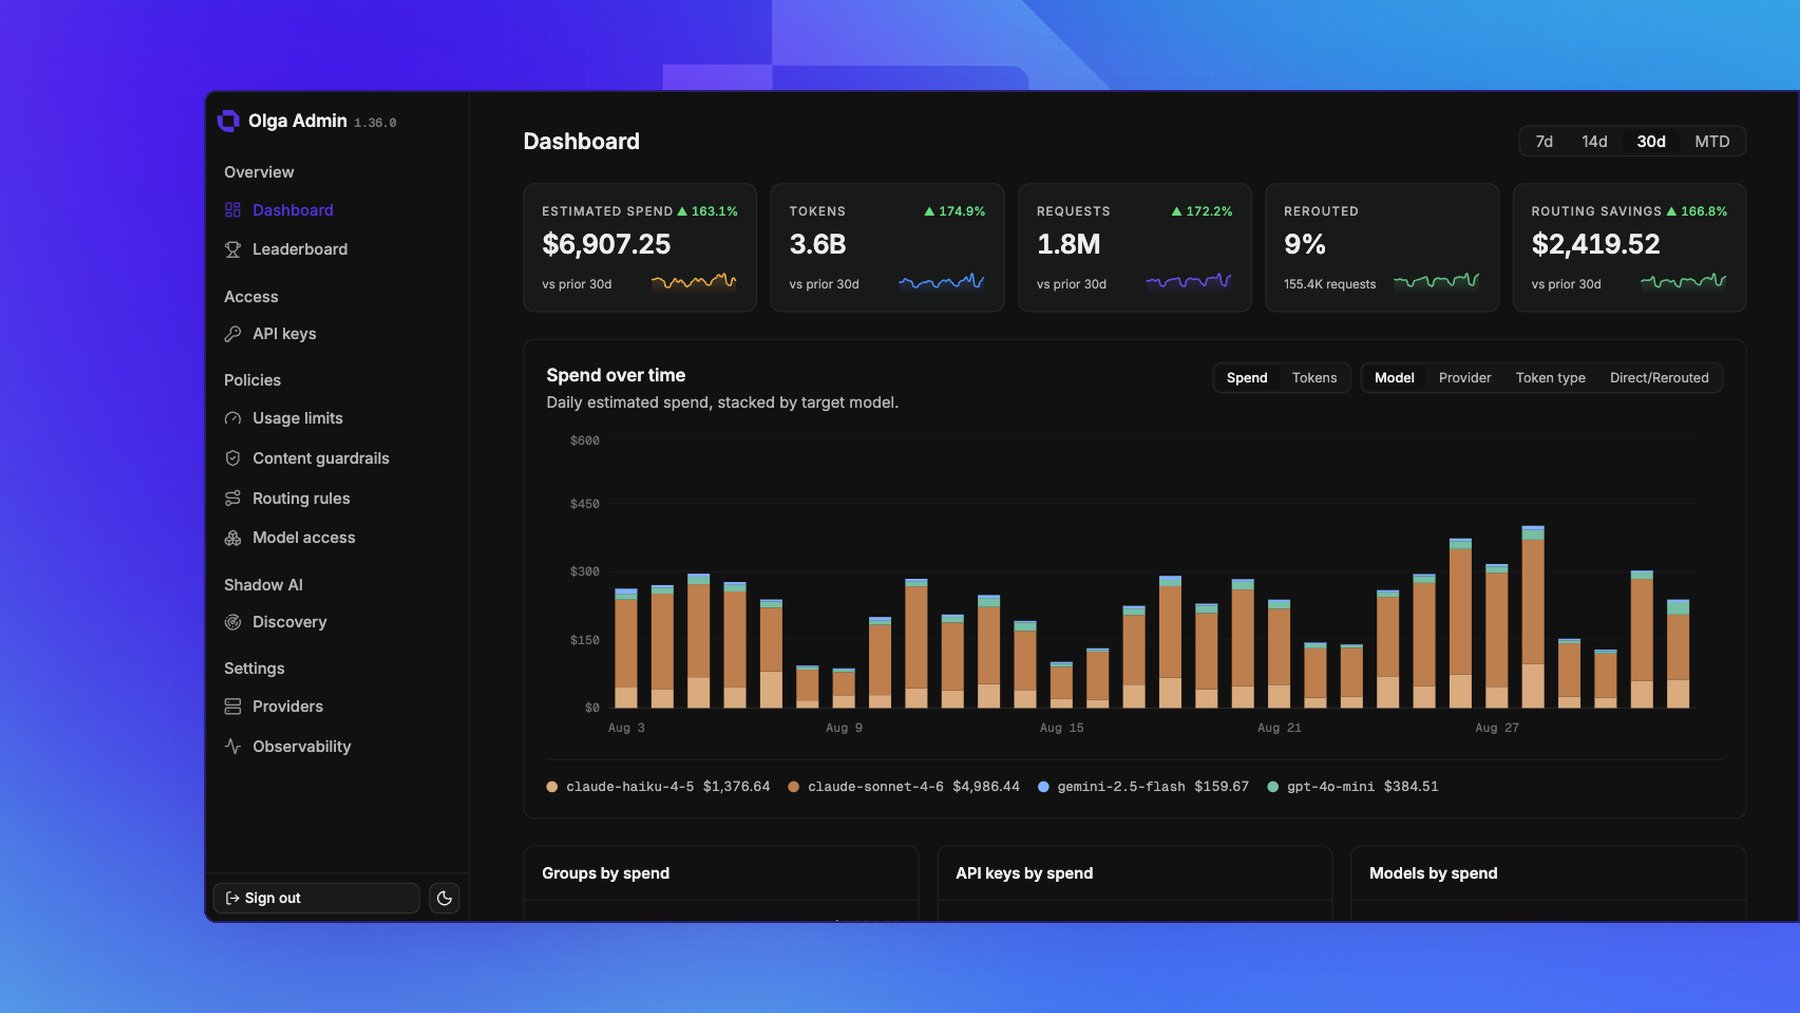
- The Dashboard shows the whole deployment: estimated spend, tokens, requests, how much traffic was rerouted and what that saved, spend over time, and the top groups, keys, and models by spend.
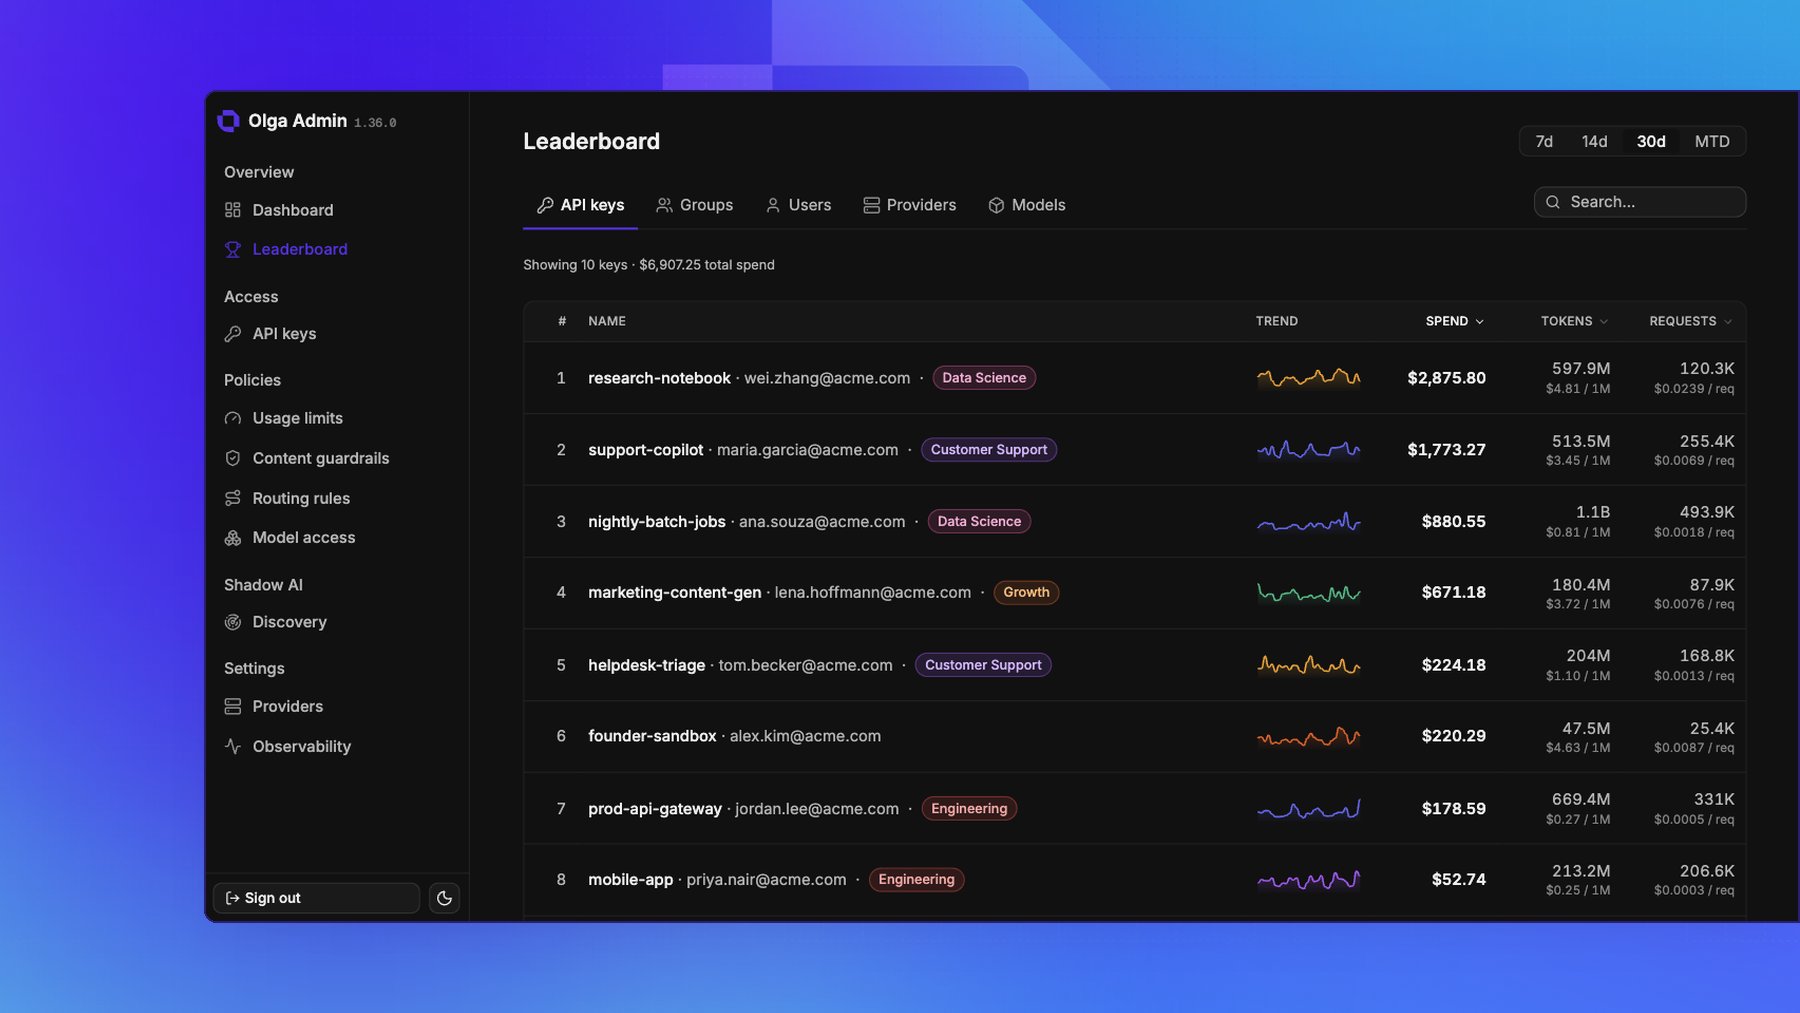
- The Leaderboard ranks spend, with a tab for API keys, Groups, Users, Providers, and Models, so you can see where cost is coming from without opening keys one at a time.
- The Usage limits page shows each limit’s current usage against its amount for the active window.
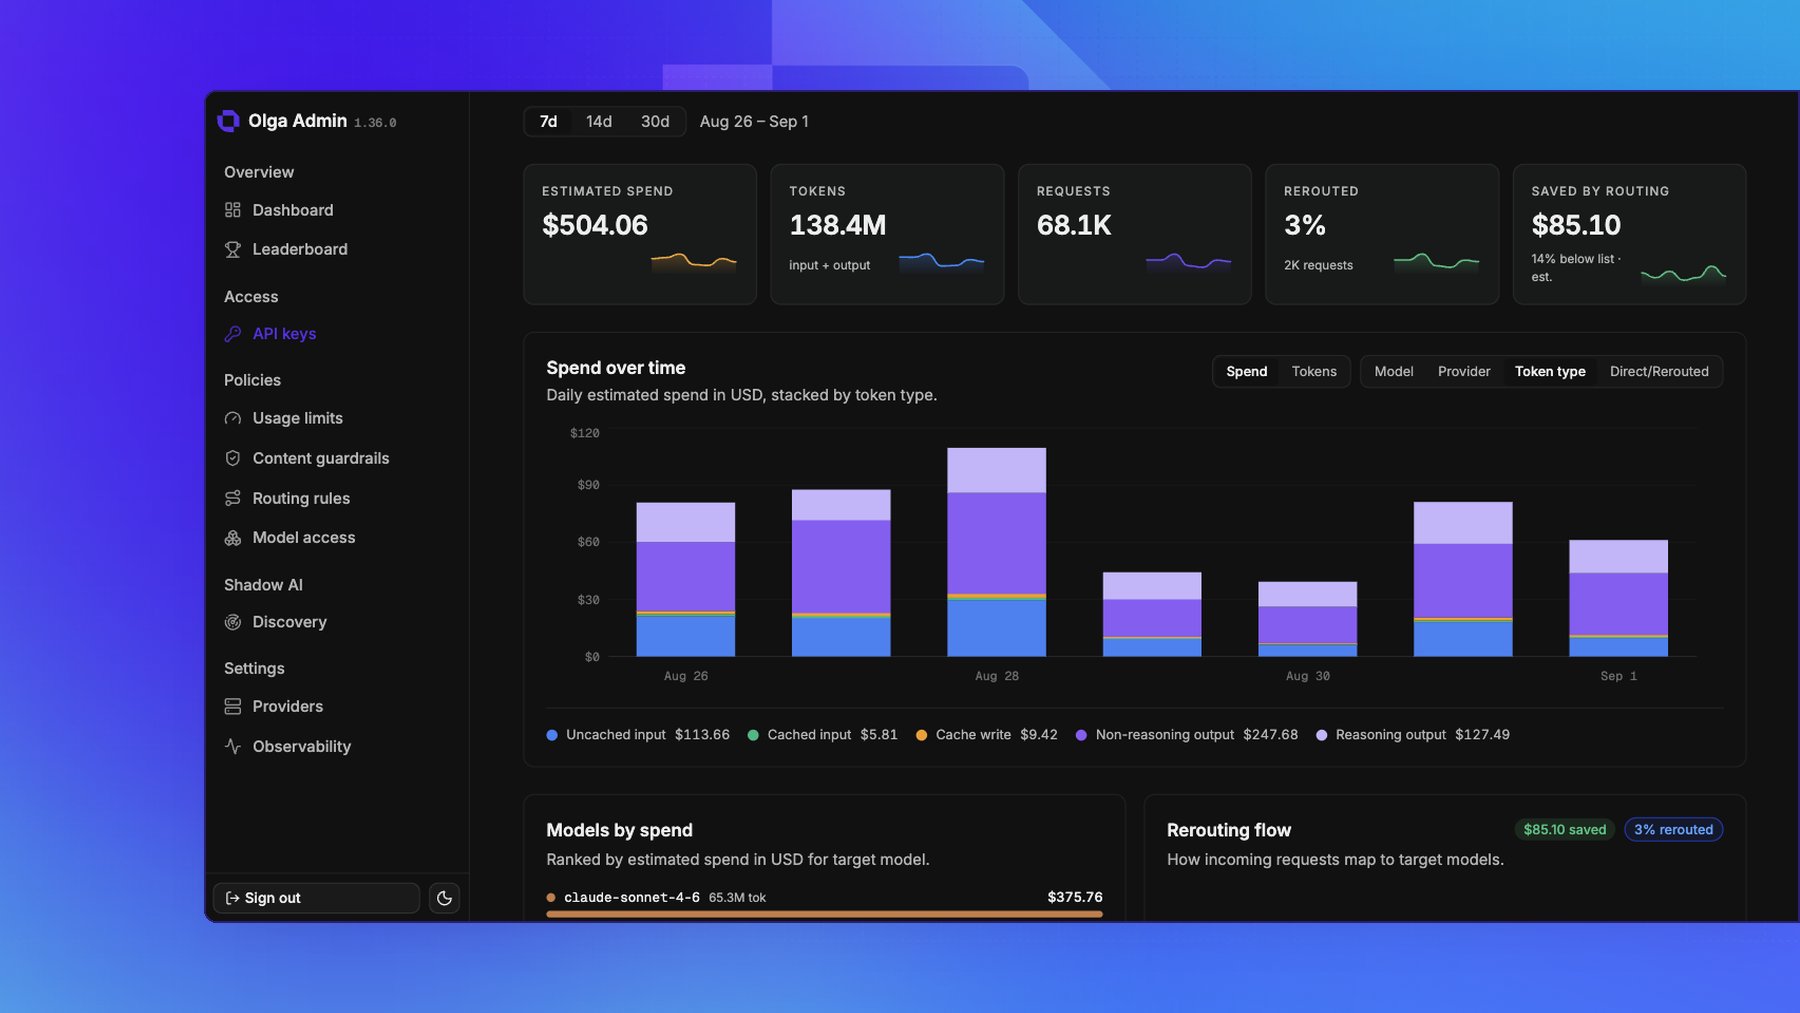
- A key’s detail page shows requests, tokens, and estimated cost over time, broken down by model, provider, or token type.
What’s tracked
For every key, the gateway records each day (UTC):- Requests: how many calls the key made.
- Tokens, split into the five types that price differently:
- Uncached input and Cached input, the prompt tokens at standard and cache-read rates.
- Cache write, the input tokens charged for populating the provider’s cache.
- Non-reasoning output and Reasoning output, so you can see how much of a bill is a reasoning model thinking.
- Estimated cost: in USD, and split across those five token types.
- Routing: which incoming model and provider the caller asked for, and which target model and provider served it.